Projects
Key Skills: Data Analysis, Multiple Linear Regression Models, Data Visualization, Power BI, Tableau, MS Excel, Data Communication, Python, SAS, R
01
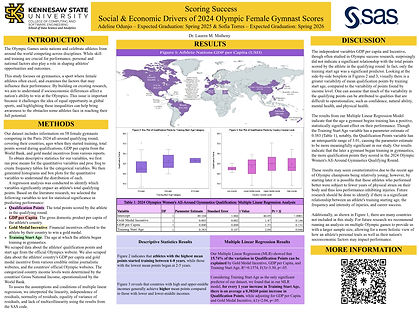
Olympic Success Predictors
Multiple Linear Regression Analysis
The purpose of this study was to determine the extent to which training age, gold medal financial incentives, and country socioeconomic status, influence Olympic gymnastics performance in female athletes.
Using Multiple Linear Regression in SAS, the model showed a significant, positive relationship between age when training began and athletic performance as measured by Qualification Points. The findings indicated that female gymnasts who started their career earlier may have endured more physical stress and mental pressure to succeed, ultimately inhibiting their ability to perform at their highest potential later in life.
Presentations:
-
National Conference on Undergraduate Research (2025) | Pittsburgh, PA
-
KSU Analytics Day (2024) | Kennesaw, GA
02
Attrition Analysis
Power BI | Exploratory Data Analysis
This Power BI dashboard is an exploratory analysis of the independent variables (such as commute, department, years at the company, salary, or job satisfaction) and their relationship with the dependent variable, attrition.
Findings:
-
Most attrition occurs within the first year of working at this company.
-
Employees that marked a lower job satisfaction rating, a longer commute to work, and a lower average work-life balance were more likely to contribute to the attrition rate.
-
Of the employees that had worked more than 23 years at the company, relationships were less predictable. For example, Job Satisfaction and Monthly Income became more varied, though there was less attrition.
After understanding some of the relationships, I created an interactive Tableau dashboard using statistical testing to determine if business travel and job satisfaction are significant predictors of attrition.


03
Real Estate Pricing Predictors
Multiple Linear Regression Analysis
In this analysis, I created a model that predicts the Sale Price of a home based on both quantitative and categorical variables. The results of this analysis could be used to assist a real estate company in accurately assigning house prices so that they can better direct clients on how to improve home value, help find houses within their clients’ budget, and maximize profit for themselves and their clients.
04
USG Student Metrics Analysis
In this hypothetical scenario, Kennesaw State University (KSU) wants to gain a better understanding of male students aged 18-24's attendance pattern throughout the year, as compared to their main competitors in the University System of Georgia (USG).
In this analysis, I simulated data of students in the thousands, and create a time-series bar chart including the percent of shares that each university holds of the male 18-24 demographic. Additional comparisons for analysis include how KSU's student attendance is performing monthly, comparing to competitors, and their monthly ranking out of the top three USG schools.
Note: All data is synthetic and created solely for the purpose of this analysis.
Click here to view the full analysis!
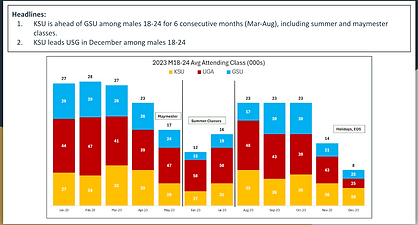

Data Visualization | Exploratory Data Analysis
05
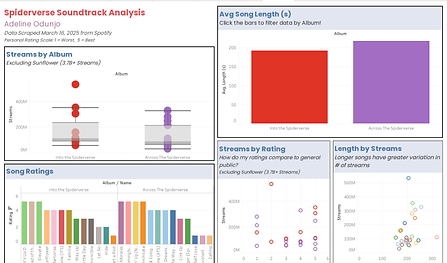
Spiderverse Soundtrack Streaming Analysis
Tableau | Data Visualization
This is an interactive Tableau dashboard which visualizes my multivariate analysis on the soundtracks from Spider-Man: Into the Spider-Verse (2018) and Spider-Man: Across the Spider-Verse (2023). Here I analyze the relationship between factors such as the length of the songs, number of streams, and my personal ratings of each song across albums.
06
Data Communication | Data Cleaning
Research Study: Impact of Digital Communication on Family Dynamics
Technology has become an integral part of both professional and personal life. Many studies have been conducted analyzing how it impacts our relationships, and since the COVID-19 pandemic, further research has been conducted specifically analyzing how digital communication impacts familial dynamics. To better understand this relationship, the researcher conducted a Google survey with 50 participants using questions to better understand the frequency of digital communication and the content of its messages. The results showed that generally, the use of digital communication positively impacted families dynamics and is used as an aid for quick, supportive connectivity.


07
College Student Analysis
Python
Using Python, I created an exploratory analysis examining college students and the relationship between Gender, Tattoo Status, Number of Ear Piercings, Height, and the number of CDs owned.
08
Medical Record Analysis
R-Studio
Using R, I created an exploratory analysis examining the relationship between Age, Gender, Smoking Status, Calories Consumed Per Day, and Fat.
Click here to view the full analysis!